One of the biggest challenges in running production infrastructures is taking a proactive approach to monitoring network health and being able to find problems before any of the tenants or users.
Continuous Load tries to solve this by being designed to run network load 24/7 across the entire infrastructure and monitor the network in both production and non-production environments.
Making sure you know what is happening on your platform and how well it is performing is crucial to offering an internal development platform. Here, we will explain how CECG is using Continuous Load to gain these insights and be in a position to fix problems before your tenants even know there is a problem.
What Continuous Load Tries to Solve
Continuous load sends enough traffic to cover as many scenarios as possible, such as:
- Exercise full network flow to gain visibility and rely on metrics and alerts to assess the impact of a change.
- Gain Confidence when introducing change not to affect tenants on the platform. Become aware of issues before a tenant reports them.
- Reproduce what applications are doing on the cluster for example DNS/UDP and HTTP/GRPC/TCP flow through the main network paths like pod-to-pod communication through service IPs
The additional traffic is designed to be low enough not to flood the network or degrade any workloads running on the infrastructure. And while any costs associated with this extra load are negligible, it more than pays for itself with the insights gathered and the quality of service being provided to tenants.

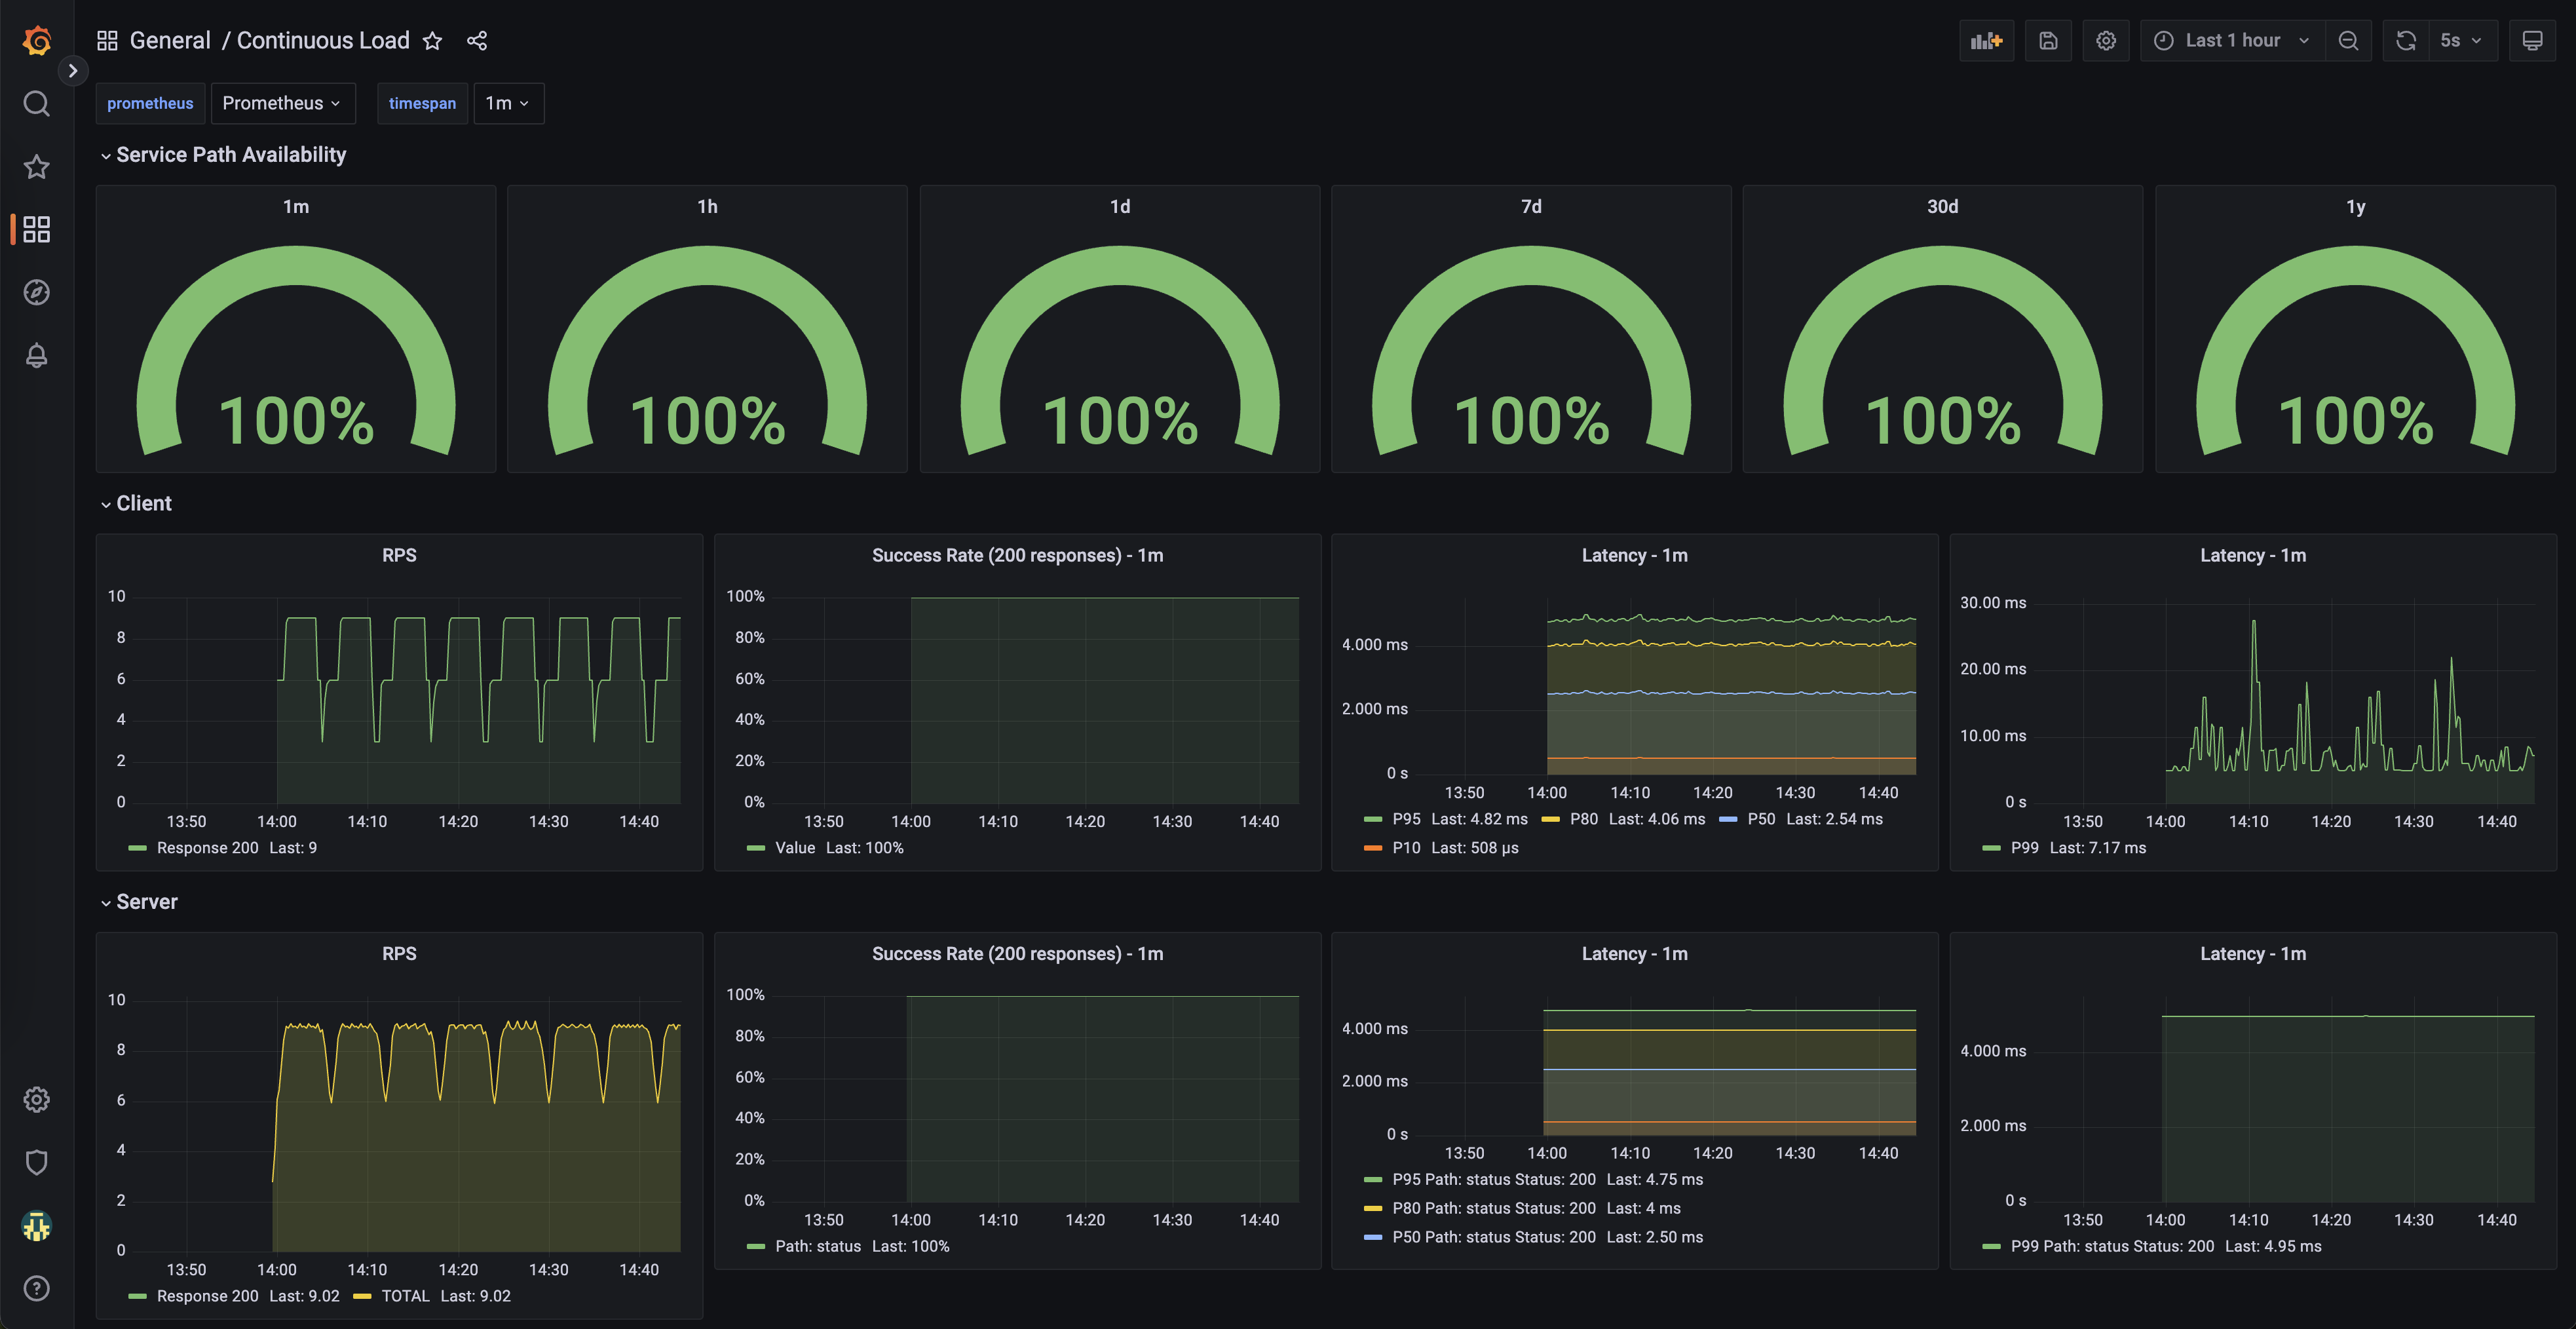
To achieve this we have built a dashboard that shows the availability of an application under a continuous load for varying periods, allowing you to monitor your service level objectives for the platform. For both sides of the service path, you can see the requests-per-second, the success rate, and the latency (split into various percentiles).
Let us now take a look at how this was achieved, by looking at the components in more detail.
Components
k6 and statsd-exporter: acting as a load-injector
Cronjob
We run k6 using a cronjob that runs every 6 minutes. This ensures that the load is continuous.
spec:
  schedule: "*/6 * * * *" # Every 6 minutes
K6 - load injector
The cronjob consists of the grafana/k6 image to which we pass the k6 configuration. This configuration can also be parameterised using environment variables, to allow control of requests per second, which endpoints to target and the thresholds for which to report failures. The –out statsd parameter configures K6 to output the results of the test to the statsd-exporter.
 containers:
  - name: k6
    image: grafana/k6
    env:
      - name: REQ_PER_SECOND
        value: "{{ .Values.reqPerSecond }}"
      - name: LOAD_TARGET_SERVICE
        value: |
          {{ .Values.loadTargetService | toJson }}
      - name: THRESHOLDS
        value: |
          {{ .Values.thresholds | toJson }}

    command: [ "sh", "-c", "k6 run --out statsd /scripts/load.js; exit_code=$?; echo exit_code is $exit_code; exit $exit_code;"]
statsd-exporter
The second container in the cronjob is the statsd-exporter. Prometheus support for K6 output is an experimental module. Hence, we use Stats, which acts as a bridge between K6 and Prometheus. K6 pushes the results to statsd_exporter and on the other hand, Prometheus scrapes StatsD.
 - name: prometheus-statsd-exporter
   image: "prom/statsd-exporter:v0.20.0"
   args:
    …
    - --statsd.mapping-config=/etc/prometheus-statsd-exporter/statsd-mapping.conf
The configuration for these containers is stored as configmaps and mounted as volumes.
 volumes:
  - name: scripts-vol
    configMap:
      name: k6
  - name: statsd-mapping-config
    configMap:
      name: statsd-config
      items:
        - key: statsd.mappingConf
          path: statsd-mapping.conf
The configmap for statsd allows us to set the histogram options as follows:
metadata:
  name: continuous-load
…
data:
  statsd.mappingConf: |-
    defaults:
      observer_type: histogram
      histogram_options:
        buckets: [0.005, 0.01, 0.025, 0.05, 0.1, 0.25, 0.5, 1, 2.5, 5, 10]
    mappings:
    - match: "k6.*"
      name: "k6_${1}"
    - match: "k6.check.*.*.*"
      name: "k6_check"
      labels:
        http_name: "$1"
        check_name: "$2"
        outcome: "$3"
This above configuration instructs statsd_exporter to:
- rewrite the K6 metrics to make Prometheus understand them
- and uses histograms instead of summaries
Podinfo: golang application
Podinfo is an open-source project which allows us to set a target of the continuous load. It is useful as it is a simple application that can be sent a mix of requests while controlling the responses.
Prometheus Operator
The Prometheus Operator is a useful way to deploy and manage Prometheus, and as a standard, we make use of this to configure the monitoring scrape rules. (The Google Cloud equivalent is also supported if running there.)
A ServiceMonitor or PodMonitor resources are used to configure Prometheus. For example, in the below, we configure Prometheus to scrape the HTTP ports on the pod with the correct label.
apiVersion: monitoring.coreos.com/v1
kind: PodMonitor
metadata:
  name: k6-podmonitor
  labels:
    release: prometheus
spec:
  selector:
    matchLabels:
      app.kubernetes.io/name: k6
  podMetricsEndpoints:
  - port: http
  namespaceSelector:
    matchNames:
    - {{.Release.Namespace}}
Helm Deployment
There are two helm charts in the repo, Prerequisites and Continuous Load:
Prerequisites: for testing purposes, everything needed to display the dashboard for Continuous Load
This includes the Prometheus and Grafana Operators. For deployments, however, consider integrating with a production-ready Prometheus and Grafana installation
Continuous Load: The run time components of Continuous Load
This includes the pieces discussed in this article, e.g. the k6 cronjob, the podinfo application, and the PodMonitors.
First, add the helm repo:
helm repo add continuous-load https://coreeng.github.io/continuous-load/
helm repo update
Then deploy the chart:
helm upgrade -install --wait continuous-load \
  --namespace ${namespace}  \
  continuous-load/continuous-load
Dashboard
Grafana Operator
The Grafana Operator , like the Prometheus operator we have just described, helps to control the deployment and management of both Grafana and its dashboards.
A GrafanaDashboard resource is used to create the continuous load dashboard. If you are not using the Grafana Operator the critical part is the json dashboard which can be imported into Granfana in your usual way.
apiVersion: grafana.integreatly.org/v1beta1
kind: GrafanaDashboard
metadata:
  name: continuous-load
spec:
  resyncPeriod: 5m
  instanceSelector:
    matchLabels:
      dashboards: {{ .Values.grafanaInstanceLabel }}
  json: >-
    {
   …
    }
Run the following to deploy the dashboard
kubectl -n ${namespace} apply -f continuous-load-dashboard.yaml
After deployment you can view the dashboard by accessing Grafana in your usual way, or if just testing it out use Kubernetes port-forwarding.