Where We Were
Driven by a long-term engagement with CECG, one of our longest-standing clients had a well-established Kubernetes-based Internal Developer Platform (IDP) known as the Core Platform running on AWS. This platform allows application teams to easily deploy, test and promote their releases through a variety of environments with complete autonomy and automation. The automation and progressive delivery also automate all of the centralised bookkeeping required to do customer-impacting production releases.
Aligning with common trends in the industry, application, platform and site-reliability teams were in early investigations into the use of GCP’s BigQuery and data-related suite of services. From lessons learned in the past, CECG identified an opportunity to get ahead of the curve and offer teams a consistent way to get their workloads running in GCP without teams having to roll their own capabilities and deal with the sprawl at a later date.
Thus, an ambitious 6-month project was planned where the gold standard for success would be that teams could simply add a new line of YAML to their CI/CD configurations and their workloads would be deployed to GCP the same way they are deployed to AWS!
The Starting Line
We first captured a high-level overview of both how changes to tenants’ code and changes to the core platform infrastructure were built, tested and rolled out across the organisation, shown here:
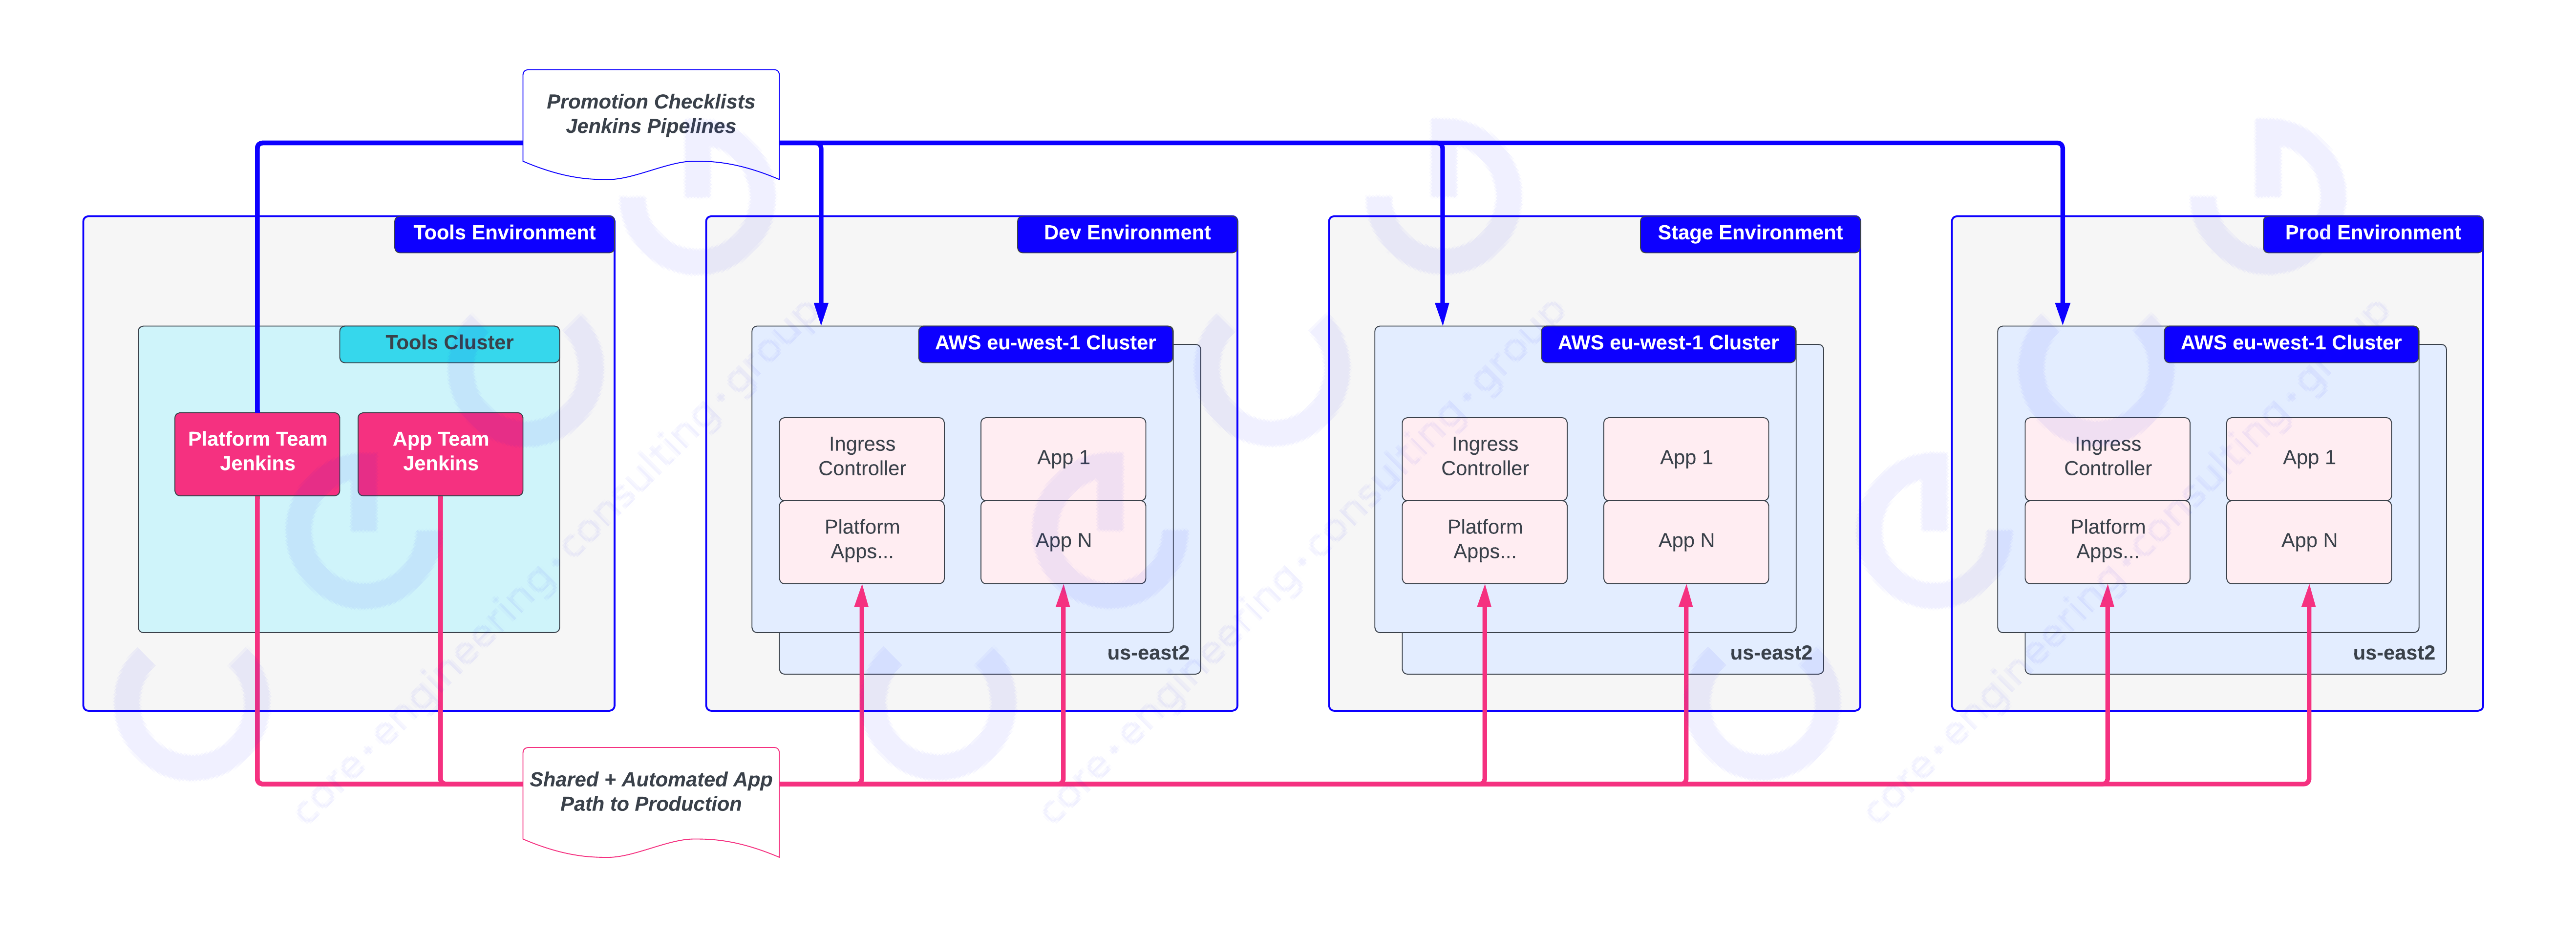
This (hopefully) looks familiar to those practising any kind of continuous delivery, the important elements of this workflow are:
- Each tenant team (including Platform teams) get their own Jenkins, running inside a Tools Kubernetes cluster (in a dedicated Tools environment)
- Core Platform provides an automated path to production where teams can specify their application’s code location, how to invoke their test suites and which environments and clusters to target
- Applications are required to implement different kinds of tests to be able to progress towards production releases
In the above figure, you can see that the Platform and Application teams (magenta lines) both use the same common path to production for core platform services and product applications.
For infrastructure deployments, the Platform team Jenkins has some additional pipelines (blue lines) that apply Terraform code to manage the underlying Infrastructure for clusters comprising all environments. These pipelines run unattended once invoked, but they are not automated from end-to-end. Engineers work through a checklist including when to execute pipelines, how long to wait and which validations must be performed before proceeding. This checklist and the pipelines and validations required have evolved organically over years of active use with a large variety in how they are defined and orchestrated. This work presented us with an opportunity to consolidate and automate the end-to-end Infrastructure code application.
The Finish Line
So, we knew where we were starting and that we had 6 months, where did we want to get to? The below diagram shows a high-level view of the desired state:
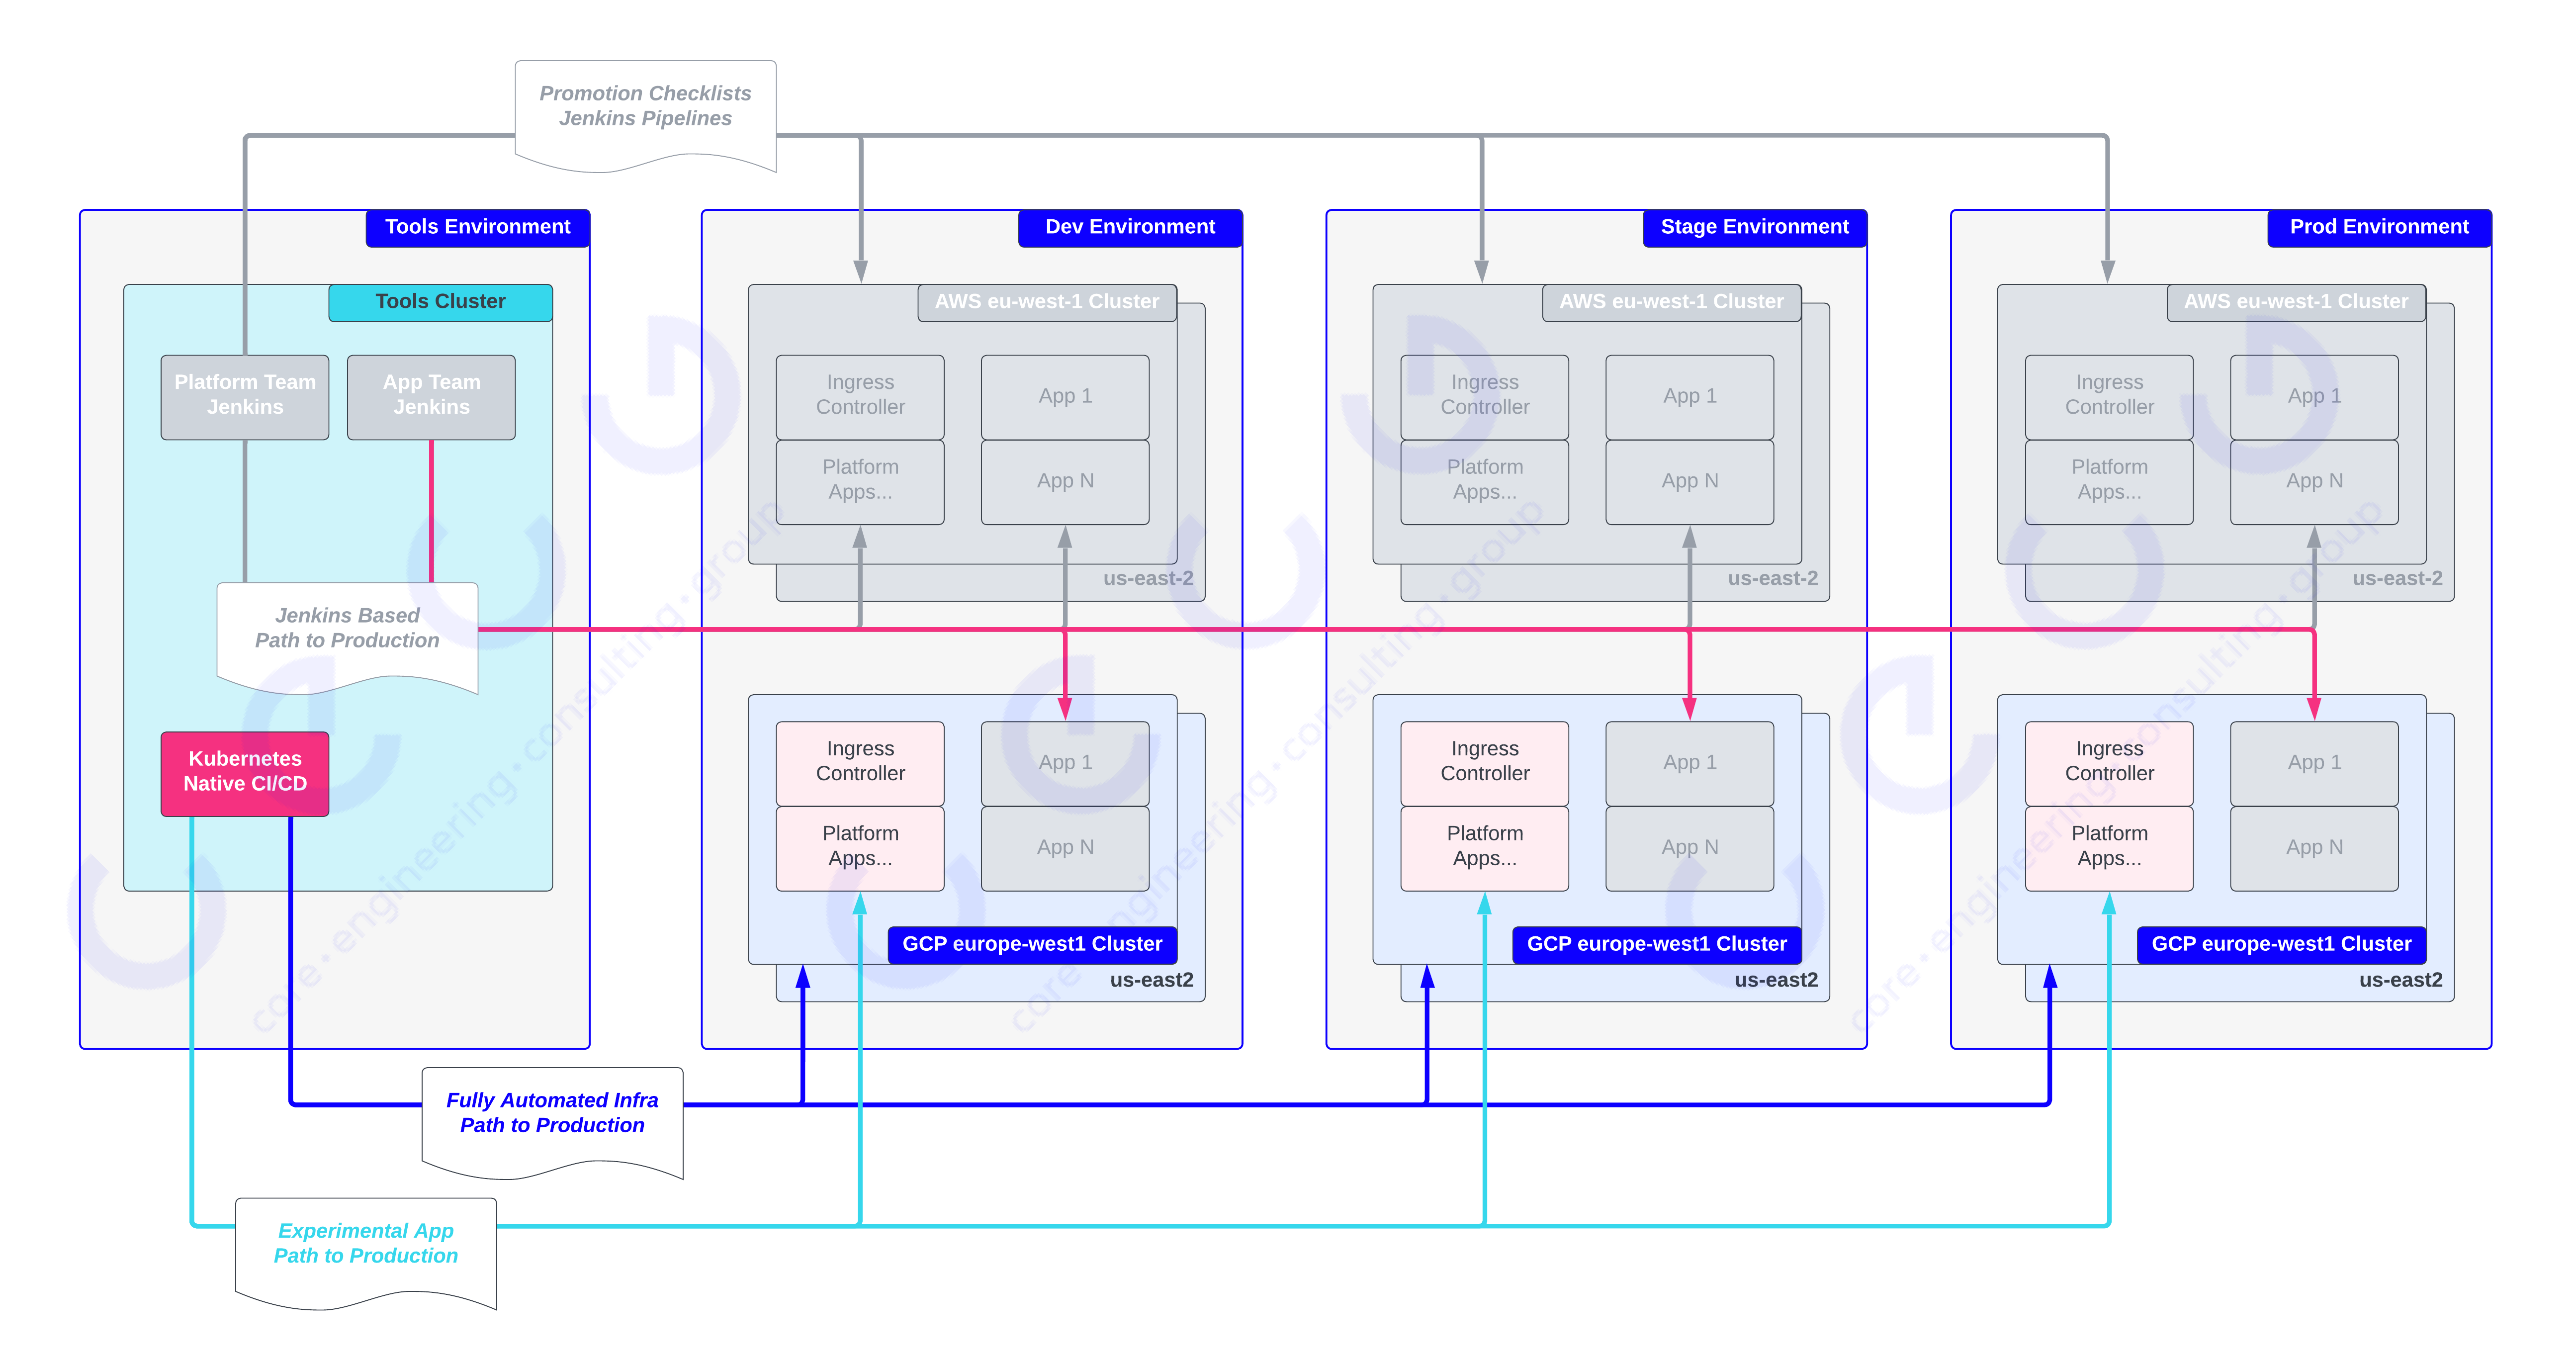
The desirable outcomes were:
- Application teams could deploy to GCP clusters with a simple change to their continuous deployment configuration, that is, they would add
gcp-europe-west2to the list of target clusters and the Core Platform would take care of the rest (the magenta line). - We would like to apply the path to production principles to the deployment of infrastructure code, to create a fully automated end-to-end Infra Path to Production (the blue line), with required types of testing between dev, stage and production environments to allow automated rollout of changes with a predictable cadence.
- Based on previous experience, we had run into pain points where we would like to be able to release Platform App changes and Infrastructure changes at the same time (e.g. if making changes to Load Balancing architecture and Ingress controllers). While we were working on a fresh slate, we knew it would be a good opportunity to explore possibilities for a new App Path to Production (the cyan line) that could be aligned with an Infra Path to Production.
For both (2) and (3) we were also given the chance to leverage CI/CD tooling that would allow us to move fast, with a strong preference for Kubernetes native approaches where pipelines and tasks could be represented as Custom Resources.
The First Hurdle
As we all know, no plan survives contact and before we even fired the starting pistol, we identified the hurdle of cross-cloud provider networking in combination with centralised network management. The process of getting a connection signed off to allow the Tools environment (in AWS) to communicate with clusters running in GCP turned out to be 2-3 months, which was up to one-half of our total target time. This prompted us to revisit the smallest change we could make to decouple ourselves from the blocker, we settled on creating a new “Tools”-like cluster in GCP, named a “Seed cluster”, in alignment with an evolving trend of KubeOps.
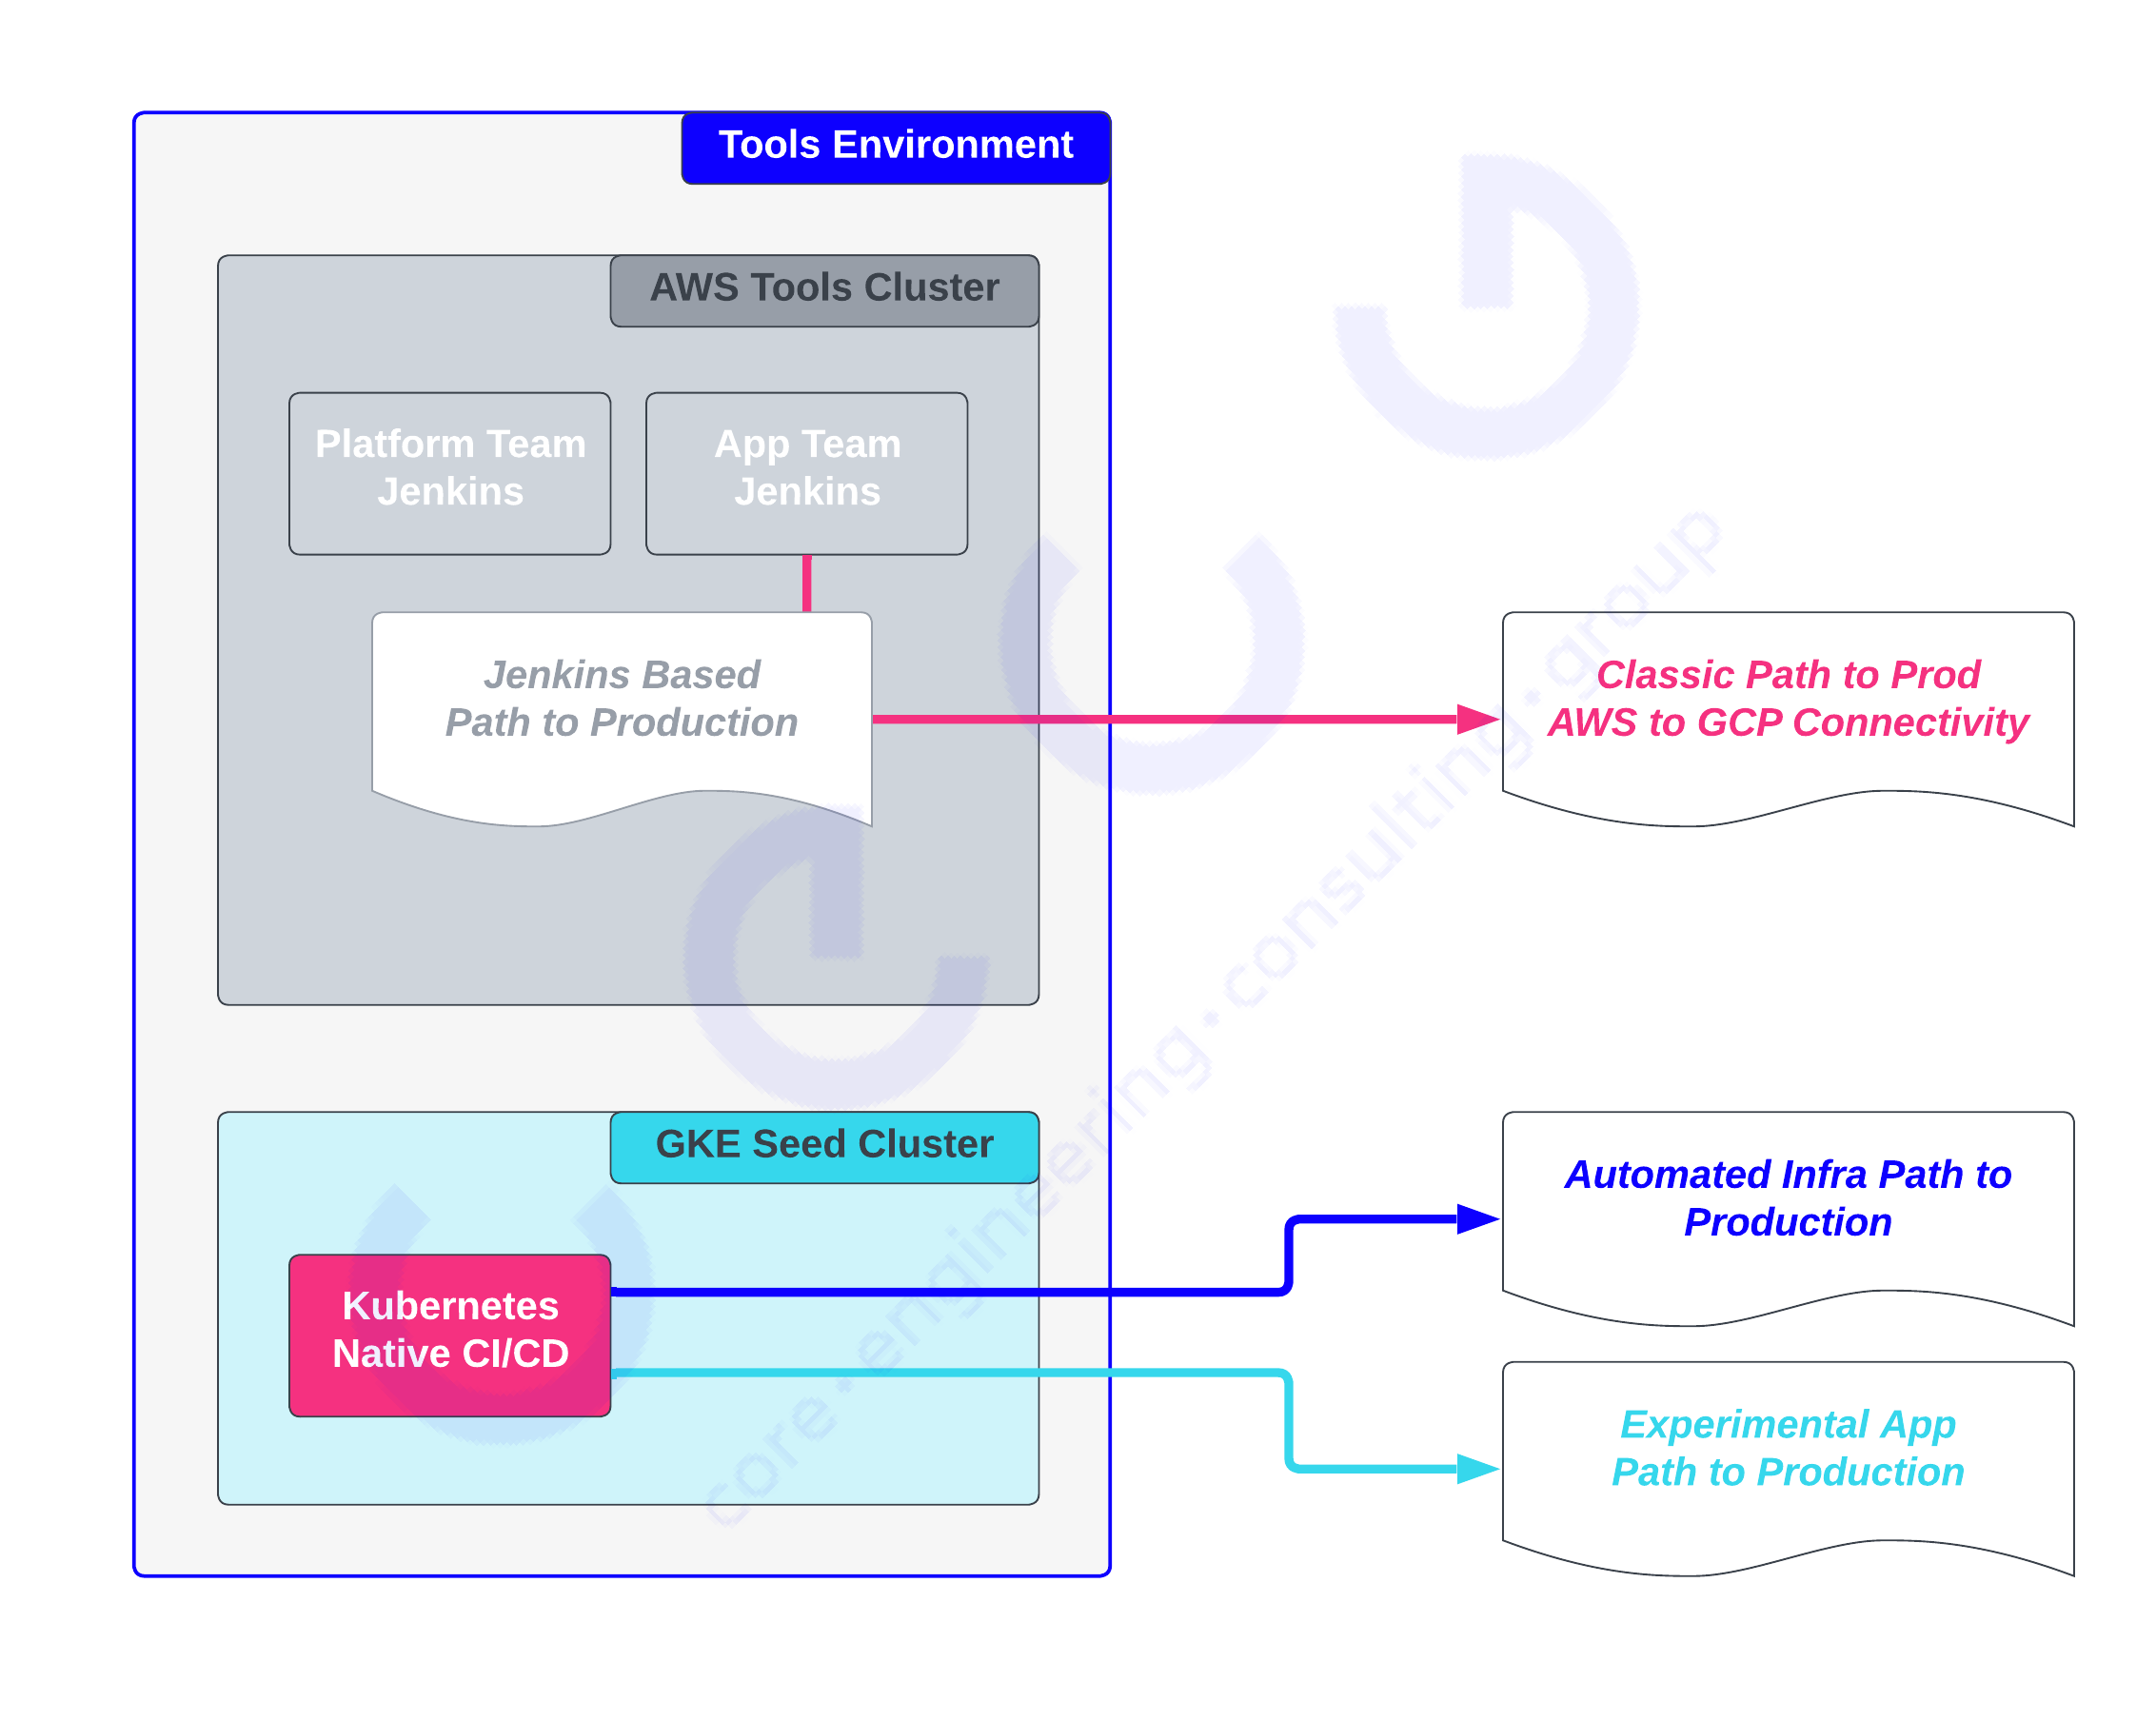
This figure shows that the Tools environment now has AWS and GCP-specific clusters. The Seed cluster in GCP would be where we would experiment with the new Infra and Experimental Application Path to Production automation, and we weren’t blocked while we waited for the centralised Networking team to organise cross-cloud connectivity to allow the classic Path to Prod to deploy seamlessly to new GCP clusters.
This allowed us to look at how our CI and CD clusters (Tools, Seed) themselves are defined. The existing Tools cluster is also the product of organic evolution and while it was captured as infra-as-code, it was not regularly exercised or automated, meaning disaster recovery or spinning up parallel versions was an unknown amount of effort.
Ready, Set, Go!
Choosing Infrastructure as Code Tooling
The first thing we set our sights on was doing a pragmatic (read as: well-timeboxed) investigation into Infrastructure-as-Code (IaC) tooling, we quickly identified our candidates:
- Terraform
- Pulumi
- Kubernetes Native approaches such as GCP Config Connector and Upbound Crossplane
Given the aggressive timeframes for the project and the lack of experience with Config Connector and Crossplane, we quickly narrowed our decisions down to Terraform vs Pulumi, opting to go with a familiar state-based IaC tooling approach. Had we gone for a Kubernetes native route, we would have chosen Crossplane due to its compatibility and extensibility across multiple service providers.
In the end, we opted for Pulumi over Terraform, owing to the following strengths in Pulumi’s favour:
- Pulumi’s opinionated model of Projects and Stacks makes it very easy to know how you’re expected to use one set of code to manage multiple instances (e.g., how you manage your config and state for N clusters using the same Infra code). There are techniques for doing this with Terraform, but nothing as well specified out of the box as Projects and Stacks.
- We found the ability to leverage the supported languages (Golang, Typescript, Python) directly led to a particularly nice developer experience, with the understanding that this experience was nice because we had engineers who were familiar with those languages. The ability to leverage the languages’ ecosystems directly was great for development and testing.
- Pulumi has great out-of-the-box support for automated unit and integration testing in all of its supported languages and a programmatic Automation library for invoking actual previews and deployments of infra code.
- At the time, Terraform did not have a good story for using the GCP provider to create a GKE Cluster and then dynamically using the generated kubeconfig as input to a Kubernetes provider within the same project. Pulumi had great support for this use case out of the box. This gave us the option to do infrastructure and base Kubernetes configuration where needed. We were fully aware this is a capability we may choose to grow out of, but it is useful to have in the early stages.
Choosing Kubernetes Native CI/CD Tooling
For the CI/CD side of things, there had been some early discovery work going on to identify suitable technologies for use in a Kubernetes Native next generation of tooling and the top contenders were Tekton and Argo . After investigation on our part, it became clear that both suites of projects could provide what we needed with no clear overall winner (a good thing, in my opinion!).
We had some experience within the team using Tekton in the past so in the name of productivity, we opted to use the 6 month project as an opportunity to evaluate Tekton, which could be later used to inform any decision-making on a wider Core Platform department scale.
Continuous Integration from Day 0
OK, maybe from Day 5? We wanted to use a pull-request model with CI tests for our Infra-as-Code projects as soon as possible. This led us to focus on writing the Seed cluster code, for clarity, we will refer to three different cluster types for the rest of this article:
- Tools cluster - The original cluster running team Jenkins instances
- Seed cluster - The new Tools-like cluster running inside GCP, using Pulumi
- Workload clusters - Kubernetes clusters that make up the dev, stage and production environments, running in AWS and GCP. The GCP clusters will be defined using Pulumi
We wrote a minimal Pulumi and iterated towards the following over the first week:
- Created a GCP project to house the seed cluster
- Created a GCP service account for the nodes in the seed cluster to run as
- Created a GCP service account that would be used to manage workload environments
- Created a network, subnet, basic firewall rules (allow SSH via private subnet) and an SSH jump box
- Created a GKE cluster named seed within the new project, using the above service account
- Enabled GKE workload identity to allow Kubernetes service accounts to impersonate GCP service accounts
- Installed Tekton Pipelines and Tekton Triggers from their publicly available Kubernetes manifests
To use Pulumi parlance, we created a prod stack (“instance”) of the above code and ran pulumi up (without too many errors, I promise). We had our first GKE cluster up and running! This cluster was completely private and inaccessible from the public internet; we used GCP’s identity aware proxy (IAP) to allow developers to access clusters via the jump box.
Now that we had a cluster running Tekton, it was time to learn about Tasks , Pipelines and Triggers . Without going too far in depth there are a few main things to be aware of:
- You can define your own Tekton Tasks (as YAML), these tasks can be run by Tekton to do specific things (e.g., “checkout a git repo”, “run a Pulumi command”, “lint Typescript files”). These task definitions are similar to Job definitions from vanilla Kubernetes.
- You can run
Tasksdirectly, or more commonly, you can compose sequences ofTasksinto a TektonPipelinewhich allows you to easily pass parameters and files between different tasks. For example, you could define acipipeline which runs a series of tasks such as Checkout code, lint code, run tests, and do a Pulumi preview. ThesePipelinesare simply YAML manifests that reference one or moreTaskobjects and provide additional configuration for sequencing and passing information between tasks. - You can define an
EventListenerto subscribe to events from supported integrations and have the listener invoke aTriggerTemplateby configuring aTriggerBinding. We used GitHub for our code repository so our configuration wasA GitHub event listener subscribed to webhook events (pull-request opened, updated, merged) from our repo
A
TriggerTemplatethat says “Run thePipelinewith the following parameters”A
TriggerBindingtakes the payload of a GitHub webhook and maps the available information into parameters to theTriggerTemplateif the observed event is a pull request open or update
With the above in place, we were able to invoke a Tekton pipeline named ci for all proposed changes raised and merged via GitHub pull requests. Our first pipeline did the following:
- Checked out the code from GitHub
- Ran typescript linting on our Pulumi files
- Ran
pulumi upon our Pulumi code - Pass the pipeline if the above tasks are all successful
The astute among you will realise that, at this point, we only had one instance of our Seed Pulumi code, a stack optimistically named prod! What we quickly discovered was we could accidentally cause the seed cluster to delete itself (if you happened to change some config that required GCP to recreate a cluster or node pool) which would, of course, kill the CI run.
To remedy this, we ran pulumi stack init … to create ourselves a ci stack to be used for CI runs, problem solved, right? More on this later. At this point, we had bootstrapped a lot of the approach that we would hope to re-use across the entire project, any changes to the Pulumi code would be automatically applied to a ci environment to check they could deploy before they could be merged.
We knew we had some kinds of testing we wanted to make sure we could do at this point, so we switched focus to the following kinds of tests:
- For some given code, ensure the cloud Infra Pulumi intends to deploy is configured as per some requirements, for example, that all folders, projects and clusters are adequately labelled with ownership and cost-centre details
- For some deployed Pulumi code, ensure that the infrastructure that has materialised at the Cloud side is configured as we expect, for example, that some resources can only be accessed via an IAP tunnel, and not via public internet.
- Similar to the above, when a cluster and some base workload are provisioned, check that some smoke test endpoint is available and responding as expected, to verify multiple things including DNS record management, firewall config, ingress manager functioning and network routability is functional.
For the first category of test, we leveraged Pulumi’s test libraries to unit test the Pulumi Component Resources we had written. Component resources are reusable, opinionated packages of Pulumi code that you can use to create multiple related resources, similar to Terraform modules.
For the first category, we also leveraged Pulumi’s CrossGuard policy-as-code functionality to be able to codify requirements around configurations emitted by Pulumi, before they are deployed to the cloud. This policy as code functionality was exercised to ensure that required metadata was specified for all GCP projects and clusters.
For the second and third categories of test, we used the Pulumi automation API to programmatically do a pulumi up against a ci environment and then run some additional test suites which used publicly available libraries to make and check assertions against actual cloud infra and available endpoints.
Workload Clusters
Now that we had a great skeleton for Continuous Integration, we wanted to get a minimal Workload cluster up and running, so we began iterating towards a Pulumi project which did the following:
- Created a GCP project to run the Cluster
- Created a GCP service account for the Kubernetes nodes to run as
- Created a network, subnet, basic firewall rules (allow SSH via private subnet) and an SSH jump box
- Created a GKE cluster named workload-<env>-<region> within the new project, using the above service account
- Enabled GKE workload identity to allow Kubernetes service accounts to impersonate GCP service accounts
At this point, you’ll see what we did, that everything we’re doing for “a plain Kubernetes cluster” is identical, whether we’re doing it for a Seed cluster or a Workload cluster. This is where we really got to grips with Pulumi Component Resources as a nice way to package up reusable code to be leveraged across a code base. We made a “Private Cluster” module which took the following inputs:
- GCP Project ID
- Cluster name
- Cluster region
This module would then produce consistent definitions for the underlying service account, networks, subnets, firewall rules, jump box, GKE cluster and workload identity configuration when used in both our Seed and Workload cluster codebases.
We quickly got to a point where we had a workload cluster Pulumi codebase, with two stacks named ci and dev. We were able to re-use the previously defined ci Tekton Pipeline which did the whole “checkout, lint, pulumi up, test” cycle. Now we wanted to lay the foundations for doing Continuous Deployment.
Our next step was to leverage the Tekton GitHub event listener to react to code merges after PRs have been approved, tested and integrated into the codebase. This was done as a set of new Tekton objects:
- A Pipeline named deploy which did a code checkout followed by a pulumi up
- A TriggerTemplate which took a Pulumi project and stack name as input parameters
- A TriggerBinding which invoked the TriggerTemplate only for merge events from GitHub
This allowed us to automate the following:
- When a change is merged to the Seed cluster codebase main branch, deploy it to the prod stack
- When a change is merged to the Workload cluster codebase main branch, deploy it to the dev stack
Hurdle 2: Network Boogaloo
We were informed that when the Networking situation had been approved and resolved, it would require an architectural change on our part to create subnetworks within a centrally managed set of host network projects with a separate set of GCP service accounts being the only ones permitted to operate within those shared network projects.
In actuality, this turned out to be pretty easy to integrate into our codebases, since we had written a reusable “Private Cluster” module in Pulumi, we could fix it once, and have it work for both Seed and Workload clusters. In addition to this, Pulumi has fantastic support in the code for creating multiple GCP provider instances each of which can impersonate a different service account. This gave us an easy path to using multiple different GCP service accounts to manage cluster projects vs network projects.
Recap
The following figure shows the state the project has reached:
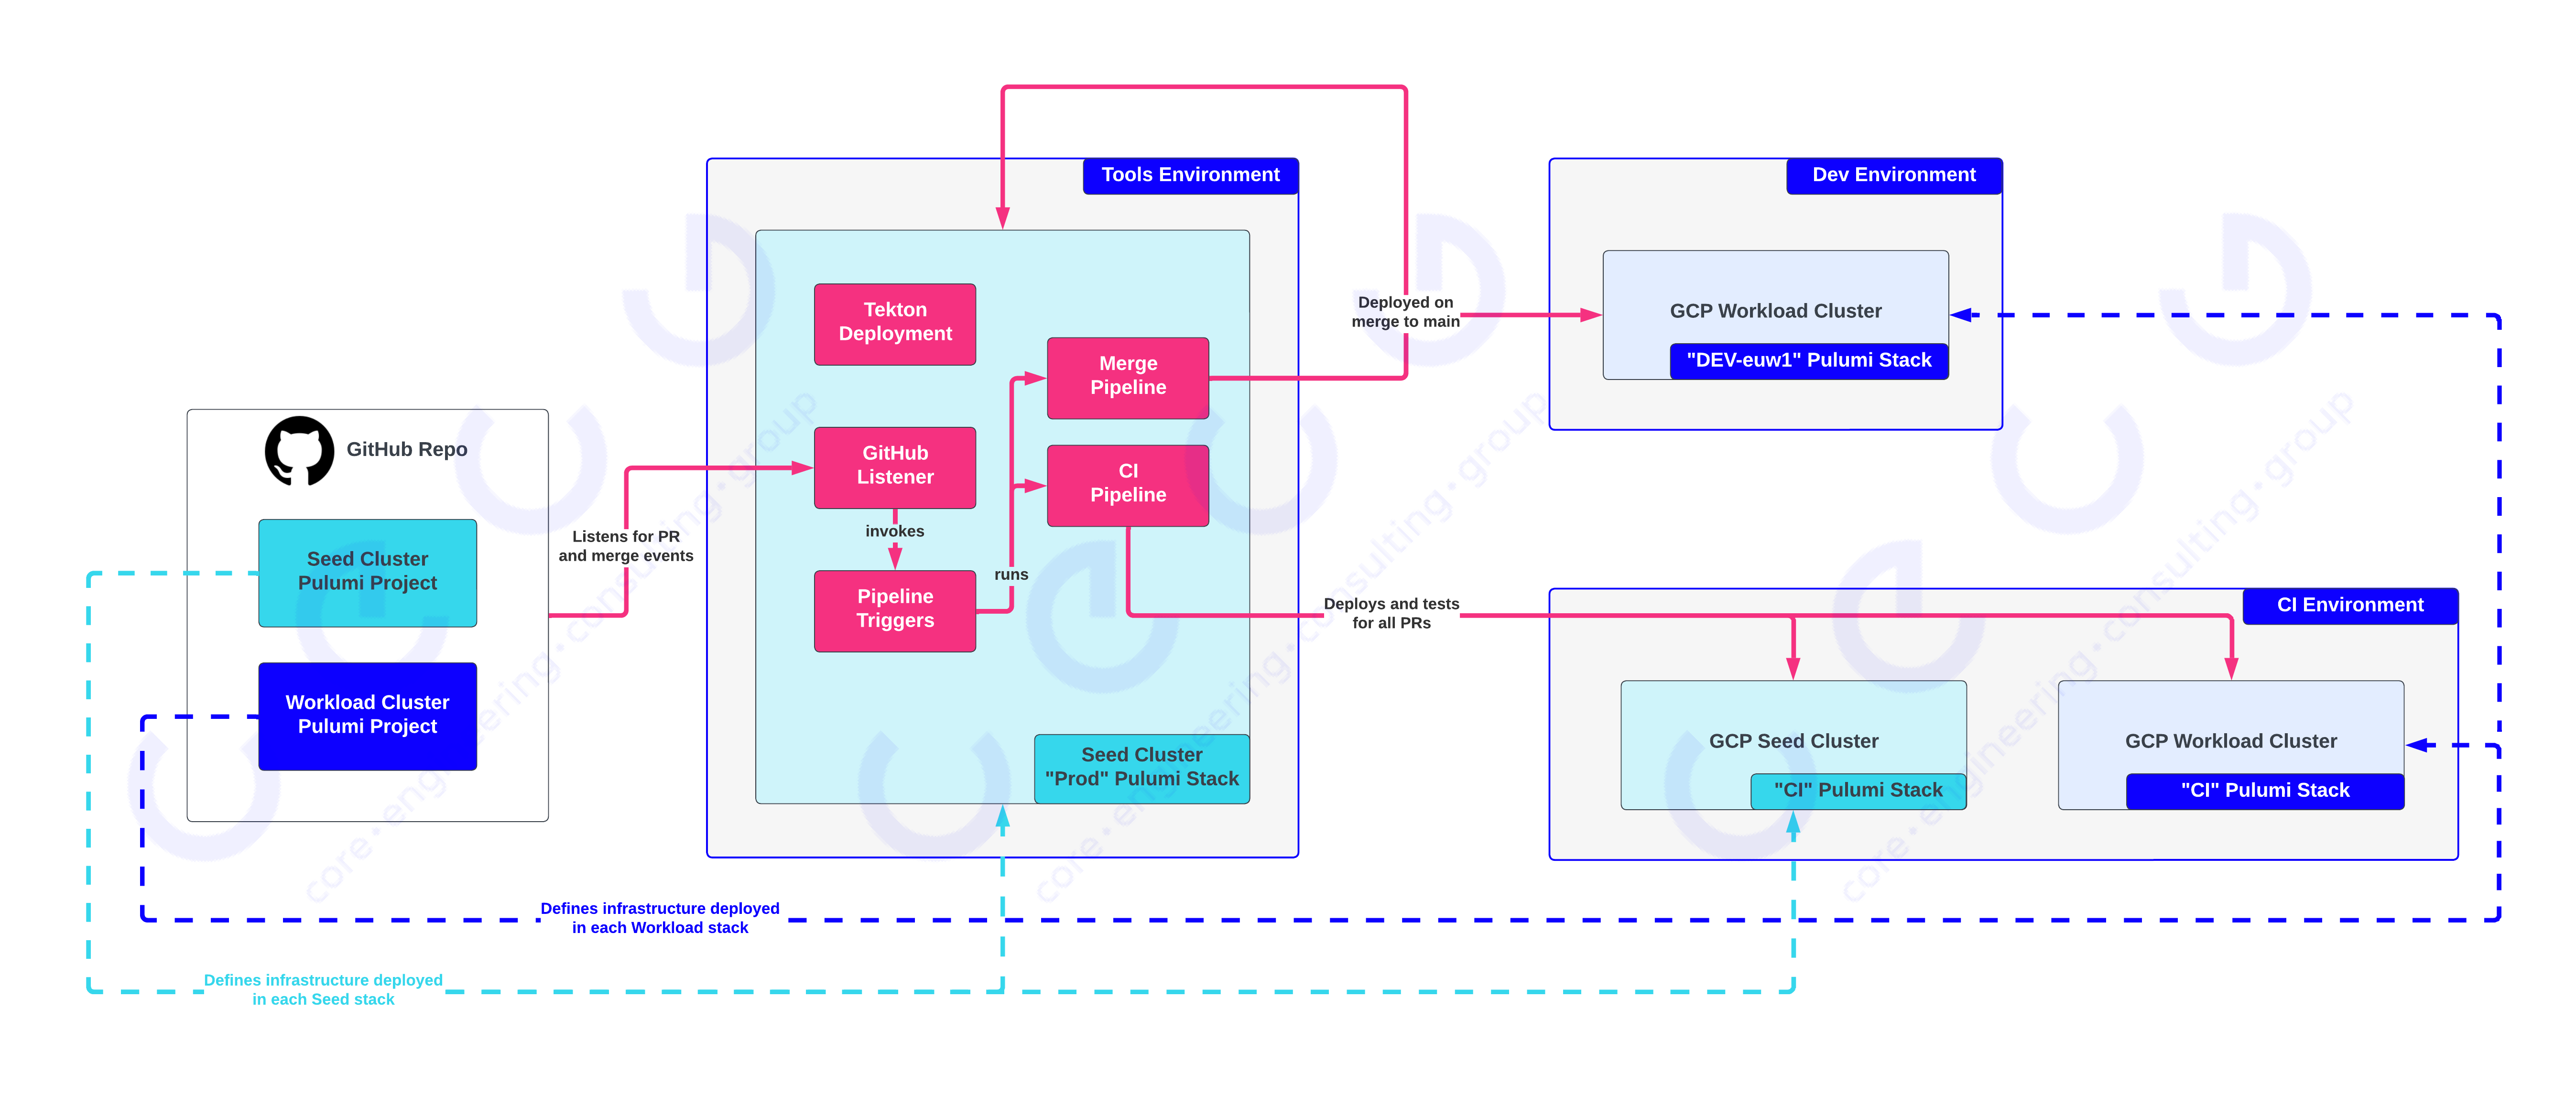
Here the dashed lines indicate the source of the codebase that defines what Cloud Infrastructure is deployed as part of a project. The solid magenta lines show the flow of requests and invocations through Tekton pipelines to test and deploy our code:
- When a PR is raised, changes to the seed cluster and workload cluster codebases are tested by the GitHub event listener dispatching invocation(s) of the CI pipeline, which will deploy to the CI stacks within the CI environment
- When a PR is merged:
- Changes to the seed cluster codebase are deployed to the prod stack
- Changes to the workload cluster codebase are deployed to the dev stack, part of the dev environment
- We have updated the Pulumi code to deploy subnetworks inside some externally managed network projects
Towards Continuous Deployment
Now that we’ve got most of the moving parts that we need:
- A Tekton pipeline that can deploy code in a sandbox and run tests
- A Tekton pipeline that can deploy an arbitrary Pulumi project to one of its stacks
- GitHub events to catch when changes are proposed and accepted
With a couple of extra pieces, we can look at full end-to-end automation:
- Some way to capture the order of environments that the Pulumi code should deploy through
- We want the seed cluster to deploy to some nonprod stack on merge, and promote to prod after adequate time/testing
- We want workload clusters to deploy to dev on merge, and promote through stage and prod on a predictable cadence, with required automated checks
- Which automated checks are required between these stages
- Releases to prod require creating a change event in some centrally managed systems and also checking if a freeze is in place to prohibit deployments
Due to the nature of some of the integrations required in gating promotions towards the production, we opted to roll our own Continuous Deployment Controller but with a strict design limitation that this controller only decides WHEN a deployment must happen, and then delegates the actual change action to pre-built Tekton pipelines (or other Kubernetes native runners, if required).
To do this, we created a Custom Resource Definition for a Delivery object which supports the following parameters:
- Which strategy to use, initially we only support Pulumi, this also determines which Tekton pipeline is used when required
- For the Pulumi strategy, the following must be specified:
- When should this delivery be evaluated (Cron format)
- Which code repository to use (and branch if required)
- Which Pulumi project within the codebase to deploy
- Which Pulumi stack within the Pulumi project to deploy
- Whether to promote an existing release, or tag and push a new release
- Any required checks that must also be successful before this delivery will be enacted
The first implementation was used to specify the following:
- Every day at 8 am
- Use the latest Git commit in the main branch to release the workload Pulumi code to the dev stack
- Tag that commits with a monotonic increasing integer (e.g., workload-dev-1)
- Invoke the deploy pipeline to deploy the new tag to the dev stack of the workload Pulumi project
We disabled the “Deploy to dev on merge to main” TriggerBinding and then our controller took over doing a daily deployment of the workload cluster code to the dev stack. We also created a sandbox environment that gets every merged change applied to it immediately, which was very useful for internal Platform testing.
With a basic strategy for deploying new changes to dev at a predictable pace, and a good suite of CI tests giving us confidence in our Component Resources, organisational requirements via policy-as-code and some integration testing against actual deployed infra, we moved on to how we could support other kinds of tests.
The first thing we agreed on was to lean into Tekton Pipelines as what we considered to be “a check” that must pass for promotion to be permitted. This was flexible enough that it allowed us to wrap up any kind of test we wanted (security reporting, peak load testing, soak testing) as a Tekton pipeline with a success status. Allowing us to configure a new Delivery object which specified the following:
- Every day at 7 am
- Pick the latest release of the workload cluster code that has been deployed to the dev stack for at least 1 day
- Require successful runs of the following pipelines targeting the latest release
- Smoke test application endpoint available
- Invoke the Tekton deploy pipeline targeting the workload cluster stage stack, using the release tag selected
To support this we realised we also needed to implement support for gating on “time since successful deployment” from related Delivery objects. After implementing this, we successfully automated a large portion of the checklist that was previously required to get Core Platform infra as code deployed to actual tenant environments, and moved towards a consolidated approach for capturing what checks are required and how they are invoked.
The final step was integrating the Continuous Deployment controller with the central change management (and freeze notification) systems within the client, to support us in specifying a new Delivery object with the following:
- Every day at 6 am
- Pick the latest release of the workload cluster code that has been deployed to the stage stack for at least 1 day
- Require successful runs of the following pipelines:
- Smoke test application endpoint available
- Require that a change freeze is not in effect
- If pipelines have passed, and a freeze is not in effect
- Create a change event with the change management system
- Dispatch the Tekton deploy pipeline to deploy the chosen release of the workload cluster code to the prod stack
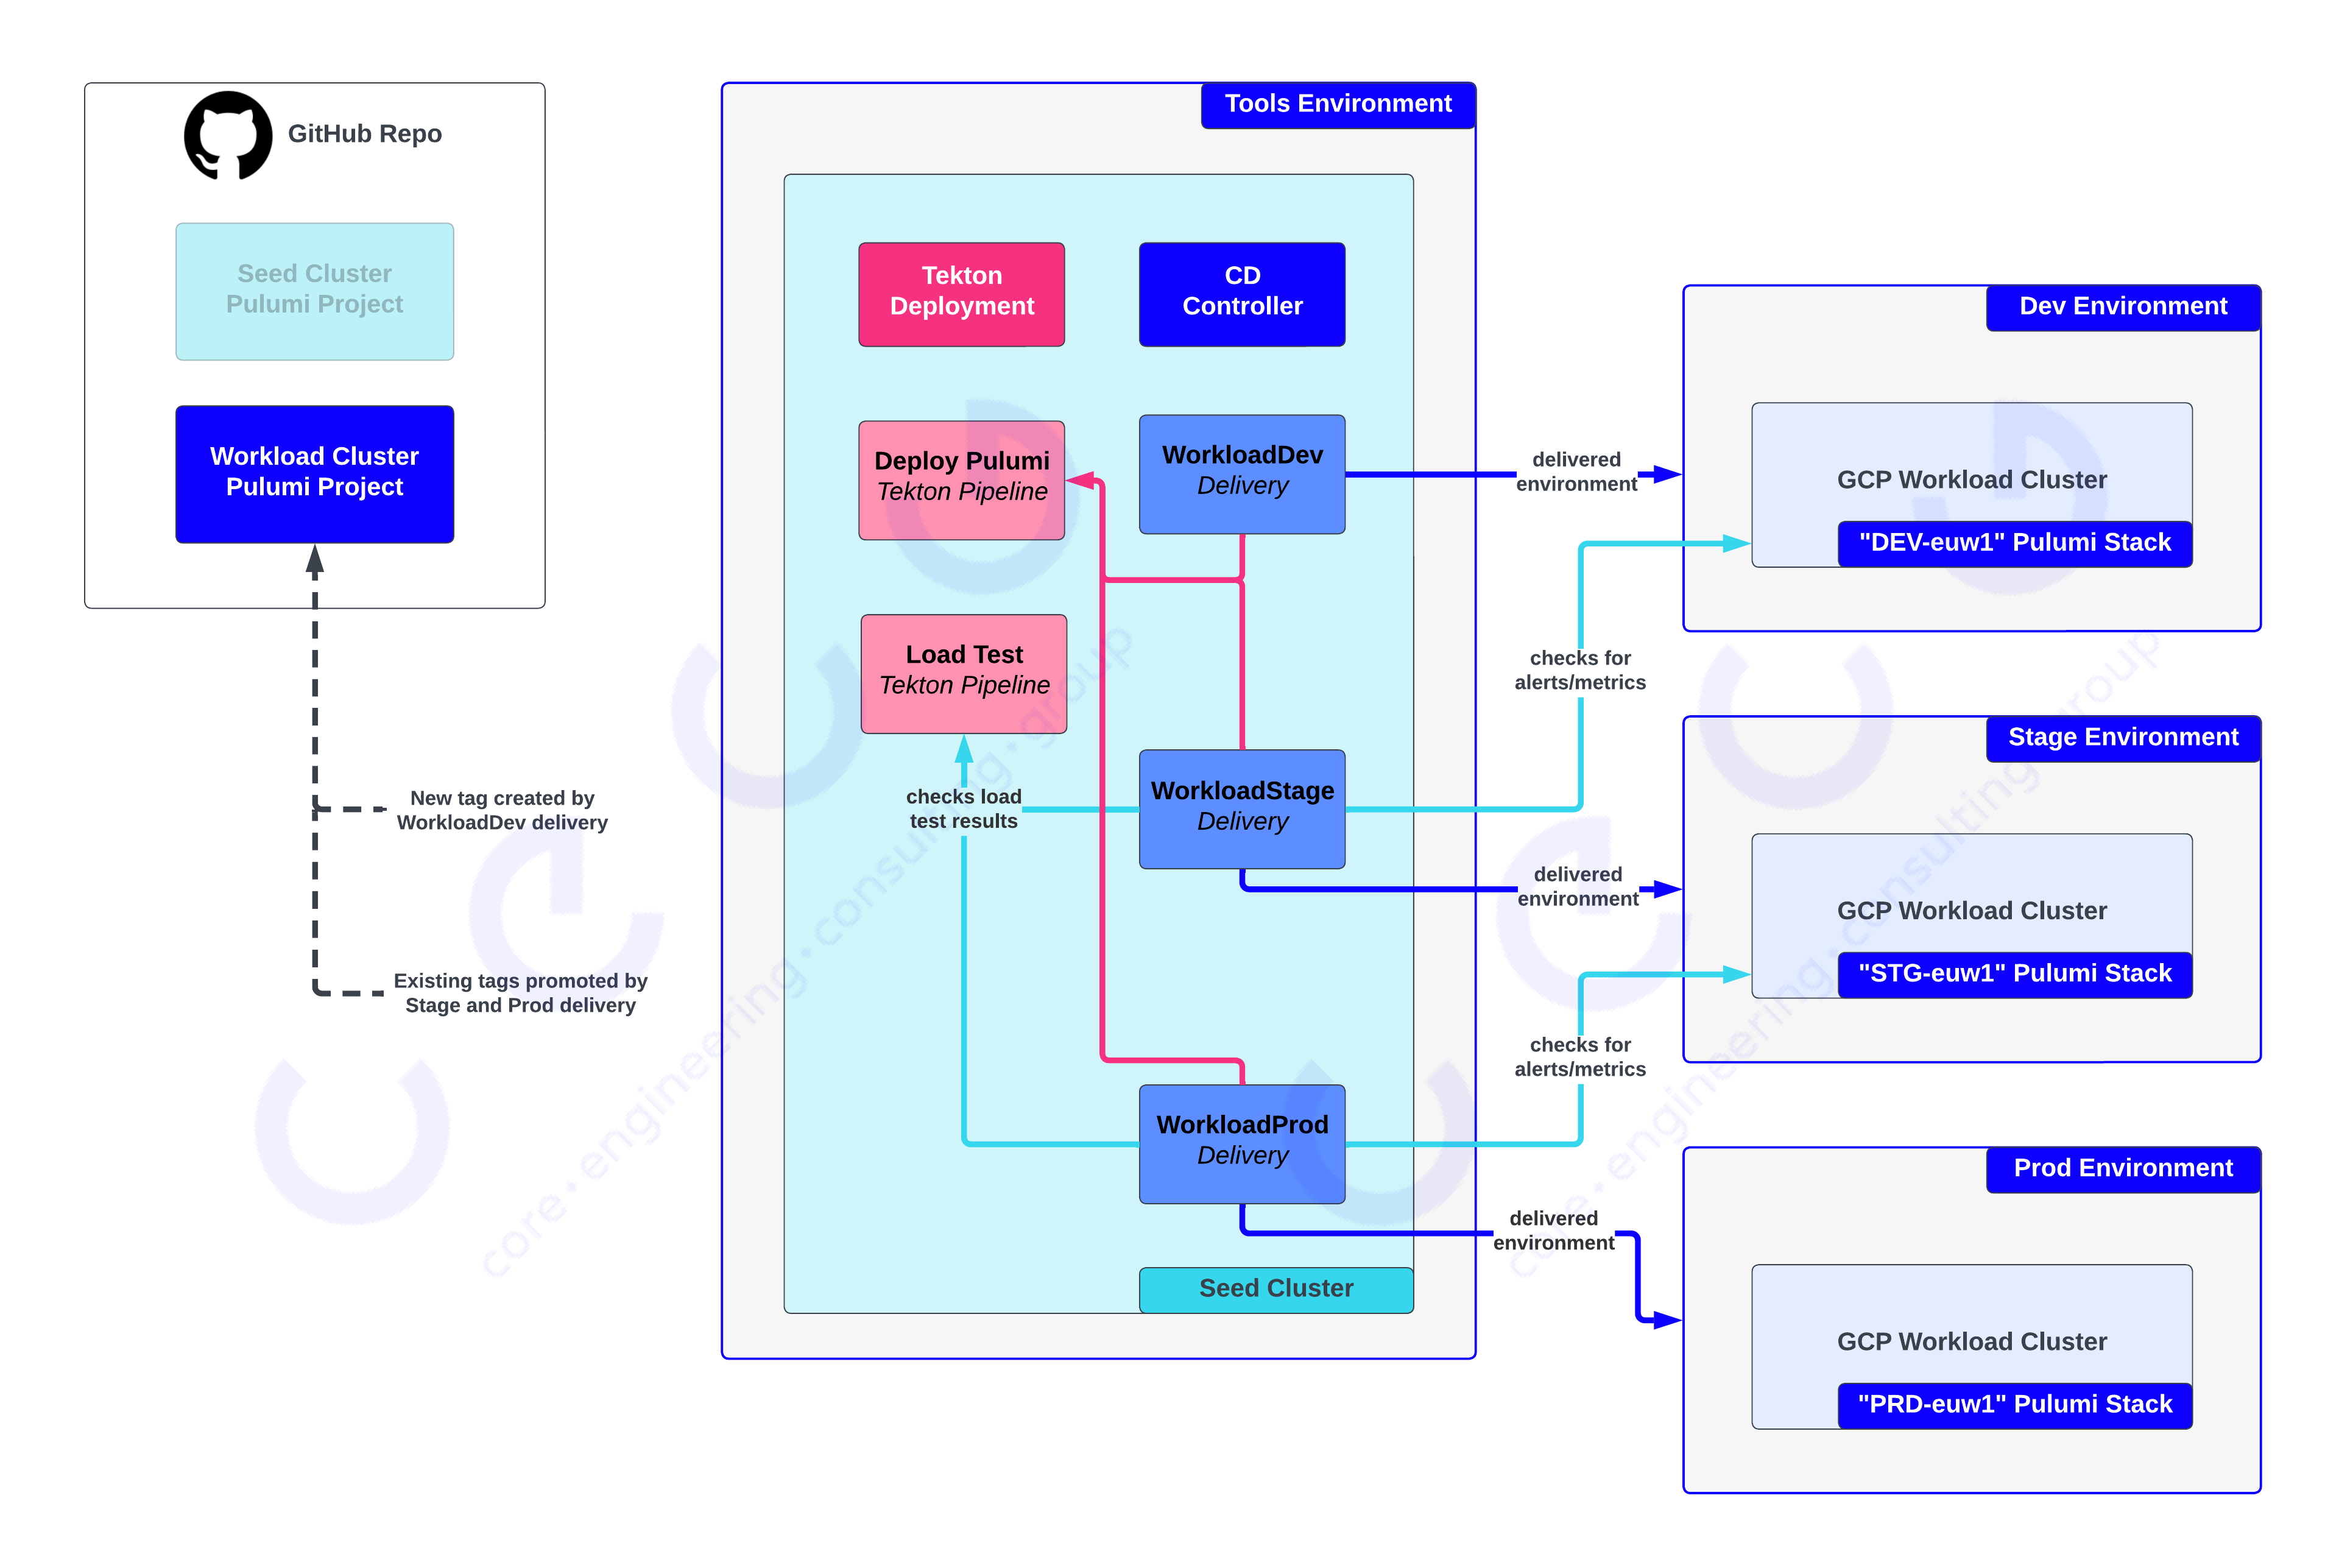
In the figure above we can see the CD Controller consulting multiple Delivery objects to orchestrate the release of new code to the Dev environment and then promote it through the Stage and Prod environments. These Delivery objects can consult a variety of data sources including other Delivery objects (e.g, stage inspects the dev Delivery), the result of Tekton test pipelines (e.g., the stage delivery checks for a successful load test pipeline), and Prometheus for metrics and alerts (e.g., ensure no critical alerts have fired before promoting a release). All of these Delivery objects reference the Deploy Pulumi Tekton pipeline to action a delivery/deployment when it needs to happen.
Et voila, we’d implemented an end-to-end strategy for Continuous Deployment of Infrastructure as Code. But what about the experimental application path to production? Well, it turns out we’d accidentally solved that along the way too.
Experimental Application Path to Production
With the Tekton and our CD Controller, we had a strategy for invoking arbitrary Tekton pipelines, one of which could support running Pulumi projects. We had also used the Pulumi Kubernetes provider to great effect, this had given us what we needed to handle the kinds of deployments that we needed to.
To prove this, we used the CD Controller to deploy our Ingress controller in GCP. The Ingress Controller used on the AWS side of the Core Platform was created before nginx controller was born, suffice it to say, it can handle incredible scale but it is designed very specifically for AWS and the architecture of those Core Platform clusters. We spoke with the Core Platform Networking team and they had a few Ingress Controllers they wished to investigate, top of the list was Traefik .
We were quickly able to produce some Pulumi code that used the Kubernetes provider to install the public Traefik helm chart into a Kubernetes cluster and created 3 Delivery objects which staged the application of that Pulumi code through our dev, stage and prod environments.
During this work, we also realised that a lot of the things we were thinking about wrapping up as Tekton pipelines were often queries over in-cluster metrics over long periods of time, in response we added a new kind of check that could simply specify PromQL queries to be evaluated as part of the checks in a Delivery object. We leveraged k6 to conduct peak and soak load tests against Traefik to further gate promotions from dev to stage and stage to prod, and used the metrics emitted by k6 to track whether required percentile latencies were within tolerances.
We wrapped up the application of the Ingress controller YAML in a Pulumi project for the sake of speed, since we had a Tekton pipeline ready to go that could apply and promote Pulumi code. Since then, a lot of work has been done to create additional kinds of Pipelines for delivering different kinds of code. We started with the Pulumi pipeline and now also have Terraform Delivery pipelines and multiple Kubernetes YAML delivery pipelines including plain kubectl and more sophisticated options like Kustomize and Helm.
Onboarding Actual Tenants
Around this time the networking situation had been approved and we had routability from our Tools cluster into the GCP Networks that our Seed and Workload clusters lived in. The next step was for us to configure OIDC integration on the Seed and Workload cluster which allowed users and machine identities to connect to the clusters and perform kubectl operations against them. Kudos to GKE for making this process as slick as it was, it pretty much worked out of the box !
Now we could do some work on the Core Platform service side to make the automation aware that new clusters were available as part of the dev, stage and prod environments. In each of the GKE clusters, we created some Core Platform Kubernetes Service Accounts and went about getting the critical Core Platform Kubernetes components running that managed roles and bindings that would allow tenant Jenkins instances to be able to deploy their applications.
Once a critical subset of Core Platform services had been deployed, we picked a friendly team and got them to add the GKE clusters to their Core Platform Path to Production configuration and… that was it, the Jenkins pipelines deployed to the new GKE clusters without any fanfare, which nobody was suspicious of, at all!
Lessons Learned
We learned a lot getting this project over the line, a few of the fun things we bumped into:
- We opted to use pnpm for TypeScript dependency management and ran into a fun edge case where pnpm caused Pulumi to encode some JavaScript in the infra-as-code state, which manifested as breaking some deployments mid Pulumi run. The lesson here was only go off-piste when you need to, we didn’t need to use pnpm but we prematurely optimised for a problem we didn’t experience (minimising the number of copies of node_modules on disk)
- We defined Delivery objects for deploying the Seed cluster code to nonprod and then prod instances, the problem here, as alluded to earlier is that the prod seed cluster can cause itself to be deleted. This is a common chicken-and-egg problem that comes up when capturing your base Infra using Infra-as-Code, one proposed solution was having the CD Controller be able to invoke GCP Cloud Run to apply the Pulumi Infra-as-Code so you can always bootstrap from zero in an automated manner.
- By using a more recent version of Kubernetes, we bumped into an issue where some AWS Core Platform clusters were on older versions, leading to a painful situation where components we seamlessly deployed across AWS and GCP hit k8s API changes.
- For tenants where they had to be aware of changes to Ingress objects which was particularly painful and accelerated both upgrade work, and bumping the priority of Ingress controller work
- Tenants were also unhappy with having to “know about” the AWS Ingress Controller and Traefik on the GCP side, which were configured using different Kubernetes objects.
- We learned, painfully, about halfway through that having your CI pipeline only do a clean application of the changed code is insufficient, you need to do an application from the main and then apply the changes in your PR so that your changes are more likely to apply cleanly.
- In the end, we probably didn’t need to write a full-fledged Controller for Continuous Deployment, the same could have been achieved purely in Tekton, or within the Argo suite of products. However, we’ve learned there is high value in having an interface (the Delivery object) that tenants can use owned by the team, further inspired by the Traefik-specific object feedback from Tenants too.
From AWS to GCP in 1 Line of YAML!
1 line of YAML, 6 months of engineering, thousands of lines of Infra-as-Code, a custom controller and lots of coffee. We hit the gold standard we set out for at the beginning of the project (with 2 weeks to spare, actually!) and raised the water for a lot of boats in the Core Platform department at the same time!
- Tenant workloads could seamlessly deploy across AWS and GCP, by simply adding one new cluster to a list of targets
- Developed an automated end-to-end Path to Production approach for Platform Infra-as-Code which is now used as the basis for all Core Platform cluster management
- The controller has been extended to support invoking more than Tekton pipelines as a way to enact change and is forming the basis of the next generation of Path to Production for tenant applications as well as Infrastructure
- The client was thrilled to have some strong bargaining power for cloud provider negotiations now that they had massively increased confidence in the ability to migrate between providers
- Provided us with a safe space to experiment with new ingress controllers which fed into the core platform’s network teams’ investigations into their next generation of ingress management
- Allowed the Core Platform department to do a thorough analysis of using Pulumi to manage infrastructure with real use cases and production workloads
- An unexpected benefit was getting exposure to using managed Kubernetes release channels which forces you to integrate Kubernetes releases into your normal operational procedures to stay supported
- Massively accelerated the progress of the core platform Observability’s ability to leverage big-query for platform-wide KPIs giving new insight into incredible metrics like total cost to serve a single play of a video